The Market Trends Report includes Inventory and Activity data in an interactive format, including month-over-month and year-over-year comparisons.
Table of Contents:
- Hover over Analytics and select Market Trends. OR Use your Quick Links from the dashboard.

-
By default, you land on the Empty State page. From here, you have the flexibility to choose between conducting a quick location search or opting for Additional Search Options to refine your criteria and explore specific trends.

-
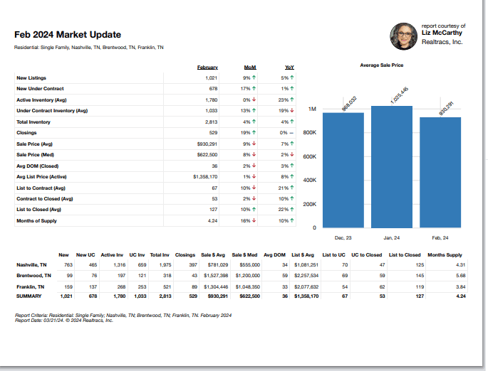
If you select the Snapshot View, it provides you with a summary of the market update for Single Family Homes based on the criteria you specified during your quick location search or additional search options. This summary covers the previous month's data by default, use the drop down to change the period selection.

-
The Average Sale Price metric is preselected in the Market Summary Overview.
 The selected row will be reflected in the bar chart to the right. The Y axis represents the number scale of the highlighted metric (dollars, days, months, # of___). The X axis represents the Time Period selected. Above each bar, the exact data point (dollars, days, months, # of ___) for the represented time period is displayed.
-
To change/customize the starting point or timeframe for all of the key metrics, select the drop down under Period Selection above the bar chart. Click the calendar icon labeled Select Month/Year. Then, you can choose a different interval of time.

You can also view a snapshot of the Last 30 Days activity (ending yesterday), and a percentage comparison to the previous 30 days.
-
To change criteria, use the search icon🔍 at the top left.

-
Add multiple Cities, Counties, and Zip Codes as well as change the Listing Category by selecting the drop down. For even more specific criteria, change the housing variables like adding list price, bedrooms, baths etc. When ready, click Run Report.
 You can draw an area on the map if you wish to see a specific area such as a subdivision, like this:
 Use the map tools such as Center, Layers and draw. Then Name the drawing and select the add button.
 Even exclude criteria as well! To exclude, enter the minus sign in front of the criteria you wish to exclude.
  You can save this criteria for future use and even designate it as the default. Click on the save icon 💾, name it, and if you'd like, mark it as the default, then click save. This will ensure that every time you visit Market Trends, the criteria will be applied automatically.
 If you decide against setting it as your default, you can still retrieve it later. Simply click on the load icon 📂 and select the name of your search.
-
You can see your preferred month data, as well as same month last year and Year over Year (YoY) percent change to the right of each metric. The red arrow indicates a decrease and the green arrow indicates and increase.
 The Bar Chart reflects the data for the past 3 years. To change the bar chart to a different metric, select the corresponding row in the in the Market Summary.
-
You can also see all Market detail below the Market Summary section. While the Summary table & chart show an aggregate of all data for your selected locations, the Detail table below shows the same metrics broken out by individual location.

-
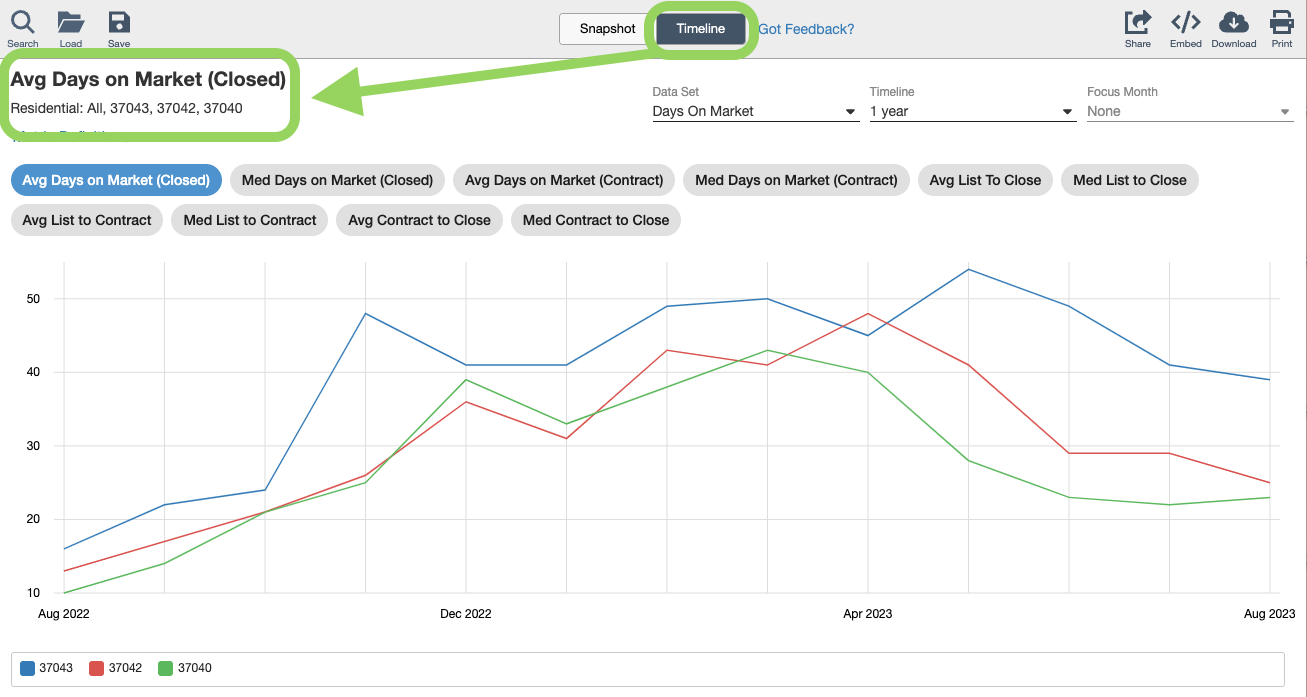
Metric, Geographical Area, Listing Category and Housing Variables selected on the Snapshot, carry over to the Timeline.
-
Here, you can choose Data Set and Timeline in the drop downs.


-
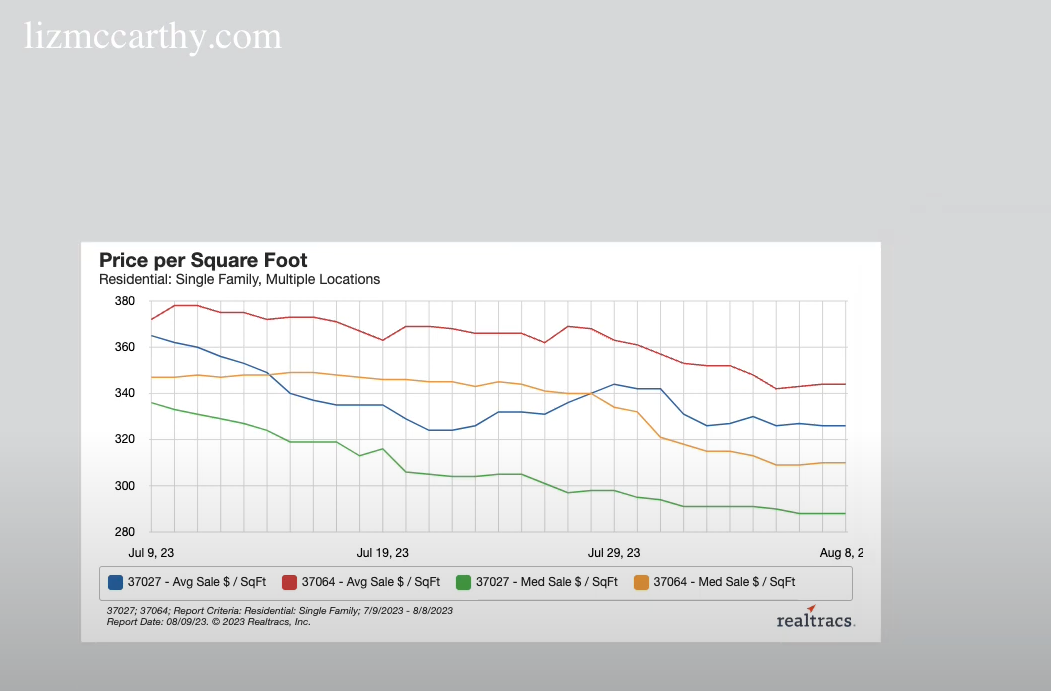
You can select a single key Metric or multiple key metrics to view on the line chart. The legend (color key) is to the right of the line chart.
 Even Showing Data is available
-
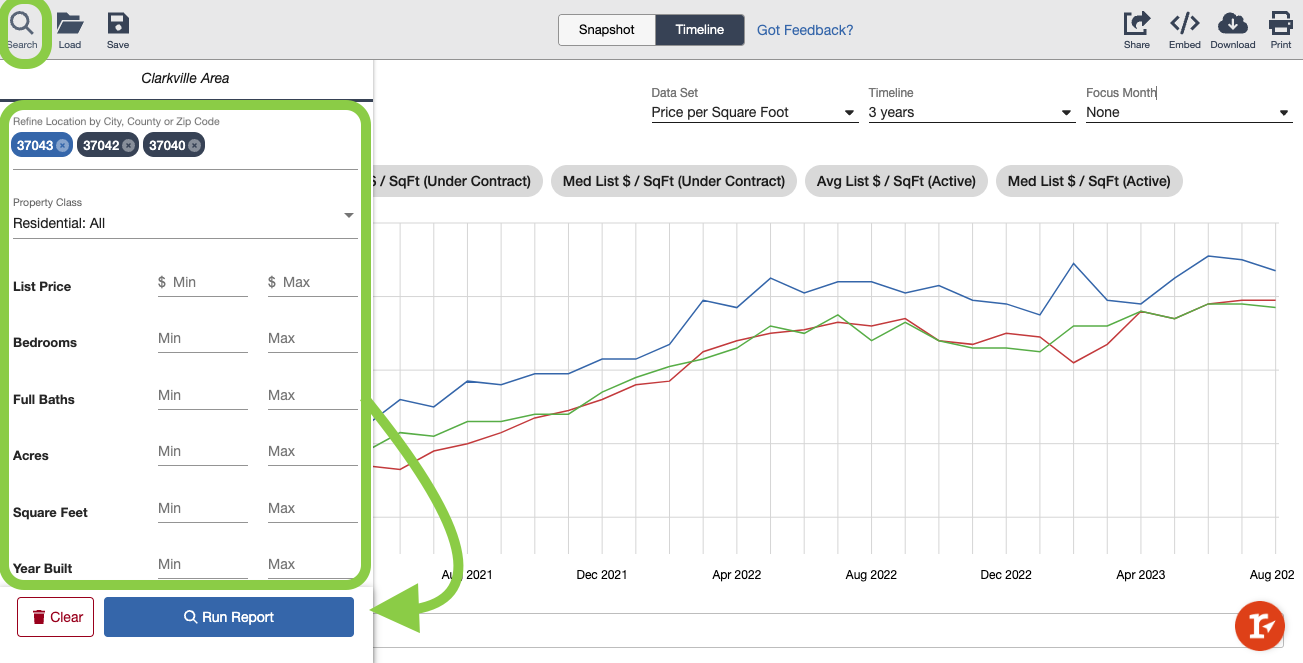
You can change the criteria from the Timeline as well. Simply click the magnifying glass labeled Refine, enter your criteria and select the Run Report button again.
-
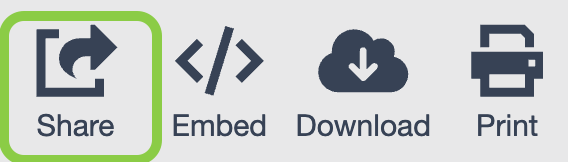
To Share the Snapshot view or Timeline view click the share icon.
 By selecting share, a tiny URL will be copied to your clipboard. You can then paste this URL into your email, text message, even social media. When the recipient accesses the URL, they will be able to view the Snapshot or Timeline view of the Market Trends directly.
https://go.realtracs.com/0wTfV3O
-
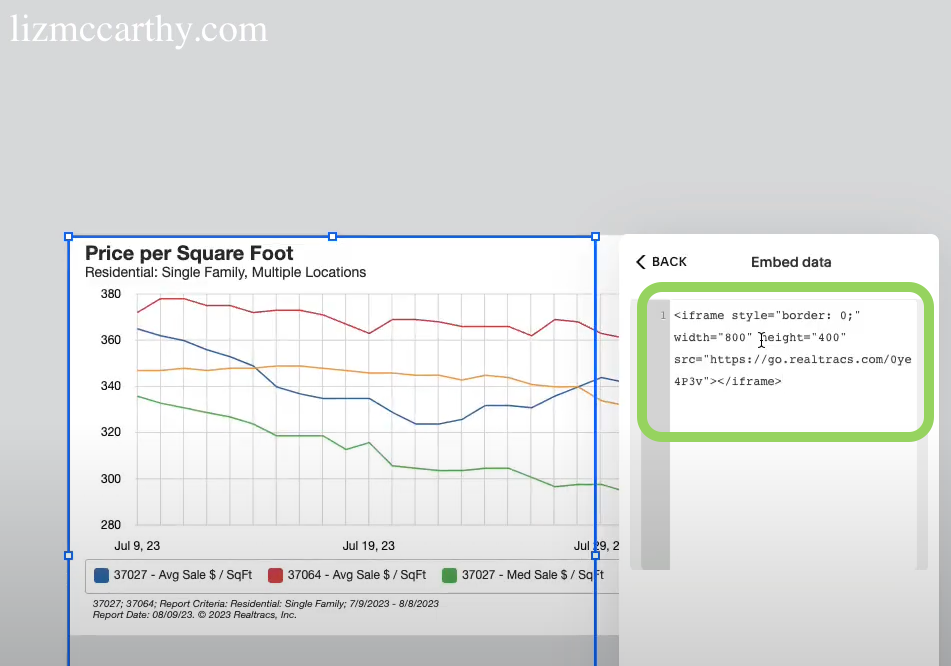
From the Timeline view, you can seamlessly integrate this data into your own website.
Click the embed icon.

Select the Chart Size.

Choose to include a chart Legend or not, then click Create Embed Code.

Next, select Copy Code.
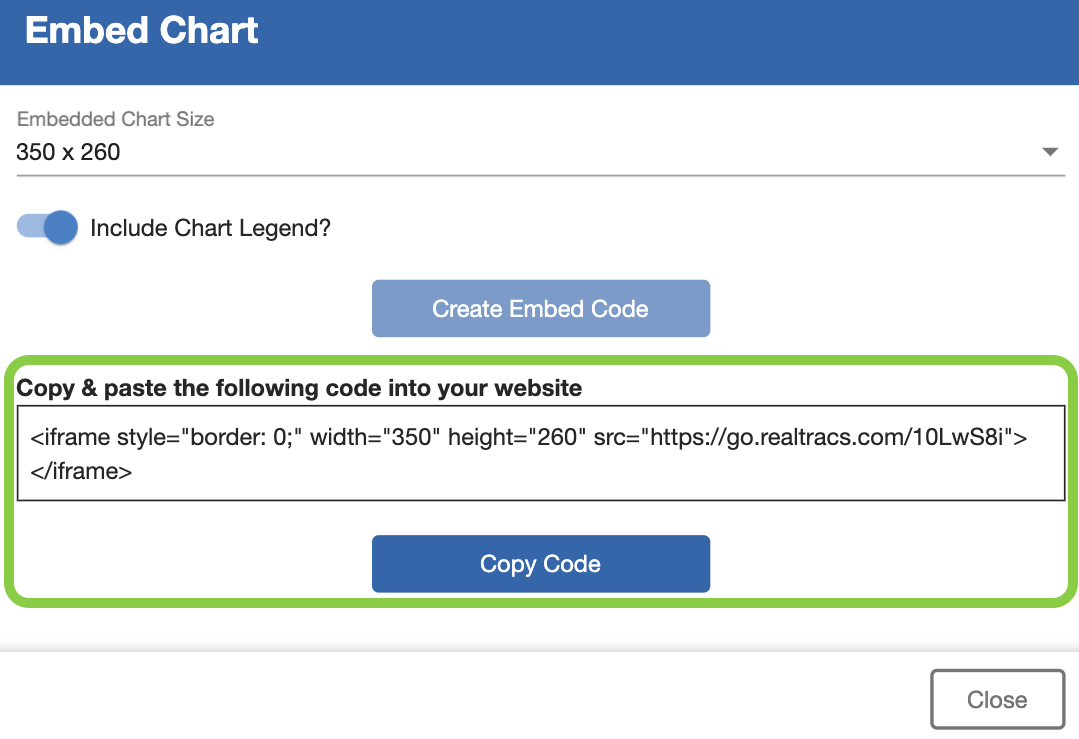
The button will turn green so you know that it is copied.

Then, just paste the code into your website where the embed feature lives.

-
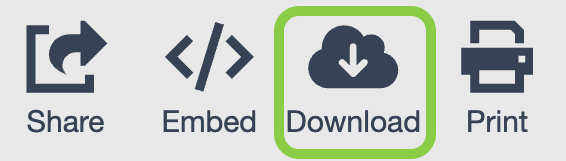
To download a .csv file of the Snapshot view in Market Trends, click the download icon. A dialog box will appear. From here choose between Summary Report or Detail Report.

Once you have selected the desired report type, the .csv file will be downloaded to your device. You can then open the downloaded file using spreadsheet software such as Microsoft Excel or Google Sheets to view and analyze the data in a tabular format.
Summary Report: This report provides a comprehensive snapshot summary of the data. It presents the essential information in a concise format.

Detail Report: This report offers more detailed information, providing a deeper analysis of the data.

-
To download a .csv file of the Timeline view in Market Trends, click the download icon.
 The .csv file will be downloaded to your device. You can then open the downloaded file using spreadsheet software such as Microsoft Excel or Google Sheets to view and analyze the data in a tabular format.
To Print
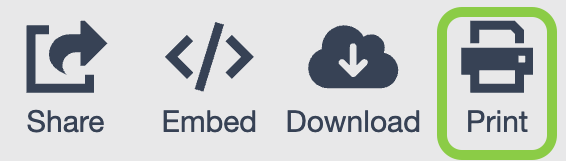 the Snapshot view or Timeline view click the print icon.A print preview window will appear. This window will display the Snapshot or Timeline view of Market Trends as it will appear on the printed document. In the print preview window, you will have options to customize the print settings according to your preferences. This includes selecting the printer, adjusting the page layout, and specifying the number of copies. Additionally, you can choose to save the Snapshot or Timeline view as a PDF by selecting the "Save as PDF" option. This will allow you to save the document electronically for future reference or distribution. After customizing the print settings or selecting the PDF option, click the "Print" or "Save" button to proceed with the chosen action.
📢 Still Need Assistance? Contact our Support Team!
💬 Chat with us! Click the chat bubble at the top right.
🕗 Mon - Fri: 7am - 6pm CST Sat: 9am - 4pm CST
✉️ support@realtracs.com 📞 p: 615-385-0777