Office Analytics helps Brokers assess overall performance and enables them to dive into specific details, as needed. Brokers can view statistics for any office or agent that belongs to the MLS.
- To begin, hover over Analytics and select Office Analytics.

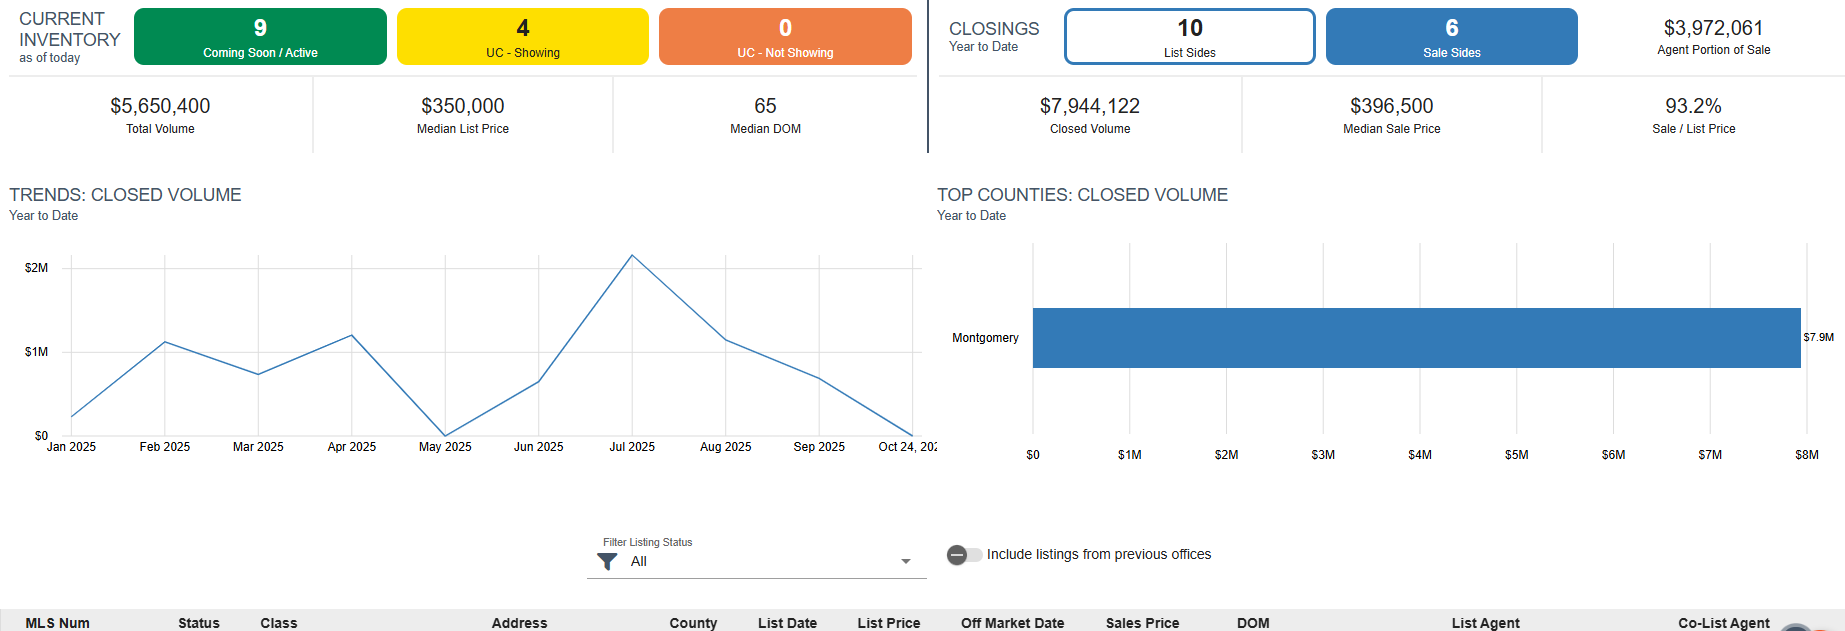
- On the Office Analytics page you can see your office's current inventory & closings. From here you can choose Property Class/es and Off Market Date. (Off Market Date is the date a listing moved into the Closed, Expired, or Cancelled status)

- Current Inventory reflects the total inventory for sale in the office as of today. Including Coming Soon, Active, U/C-Showing & U/C-Not Showing.

- Closings reflect the number of closings the Office has had as a whole; for Listing Agents (List Sides), for Buyers Agents (Sale Sides), and the dollar value for Agent Portion of Sale in the given timeframe you selected. You can also see the Closed Volume, Median Sale Price and percent of Sale vs List price.

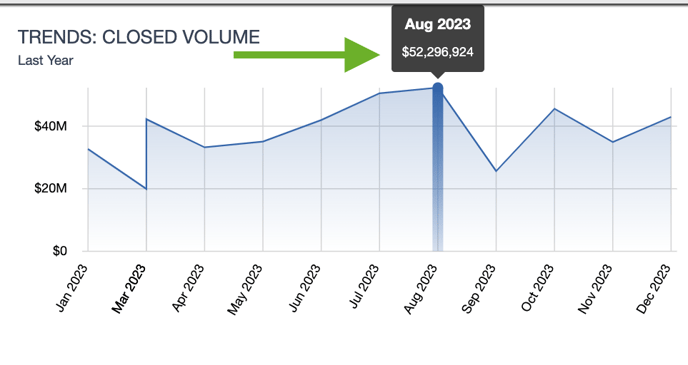
- Below Current Inventory/Closings, on the left you see Trends for closed volume in a line chart view. Hover over the line you wish to see the dollar amount for.
- On the right you see Top 5 Counties closed volume for the Office as a whole in a bar chart.
*Note-if the office has closed properties in more than 5 counties, only the top 5 will show in the bar chart.

- The Detail Table below reflects the same metrics broken down. You can see the totals for the office as well as for each agent in your office.

- You can easily Download the details into a spreadsheet by clicking the download button.

- To see Listing Detail, select Office Totals or a specific agent in your office and the corresponding number you wish to see listing detail on.

- Choosing the Office Totals allows you to filter the Listing Statuses.

- Each column in the Listing Detail Table can also be sorted.

- Choosing Your Agents number brings you to their Listing Detail page, here you can choose Property Class, Off Market Date and Filter Listing Status.
Notice that the Current Inventory, Closings, Trends closed volume and Top Counties closed volume changed from the OFFICE #'s to the AGENT #'s. *Note-if the office has closed properties in more than 5 counties, only the top 5 will show in the bar chart.

- To Download the Agent details into a spreadsheet, click the download button.

- You can also select the MLS #. This will open a new tab in listings Property Report.


- To view statistics for any office or agent in Realtracs, simply click the magnifying glass to Search by Agent or Office.

- When searching for a specific agent, the webpage will automatically scroll down to the Detail table and highlight the corresponding row in the list of agents.

- You can easily Download their details into a spreadsheet by clicking the download button.
- To return to your Office numbers, click the My Office Icon.

📢 Still Need Assistance?? Contact our Support Team!
💬 Chat with us by clicking the chat bubble at the top right
🕗 Mon - Fri: 7am - 6pm CST Sat: 9am - 4pm CST
✉️ support@realtracs.com 📞 p: 615-385-0777